So, just how radical is Labour’s ‘£8 by 2020’ minimum wage pledge?

At the weekend, on the eve of the Labour party conference in Manchester, Ed Miliband used an interview in the Observer to reveal that, if elected in May 2015, a Labour government will raise the National Minimum Wage (NMW) rate to £8.00 per hour “by 2020” – which most observers have interpreted to mean from 1 October 2019, when the last annual uprating under the next government will take place.

Reaction has been mixed. Conservative Central Office was quick to claim that the pledge amounts to a slower rate of increase than that between 1999 and 2007.  At a conference fringe meeting, the right-wing commentator Iain Dale suggested that “£8.00 by 2020 is hardly a radical policy”, and the Fabian Society’s Andrew Harrop tweeted that “we need to go further and faster than £8 per hour by 2020”. On the other hand, the move was welcomed by the TUC and the trade union UNISON.

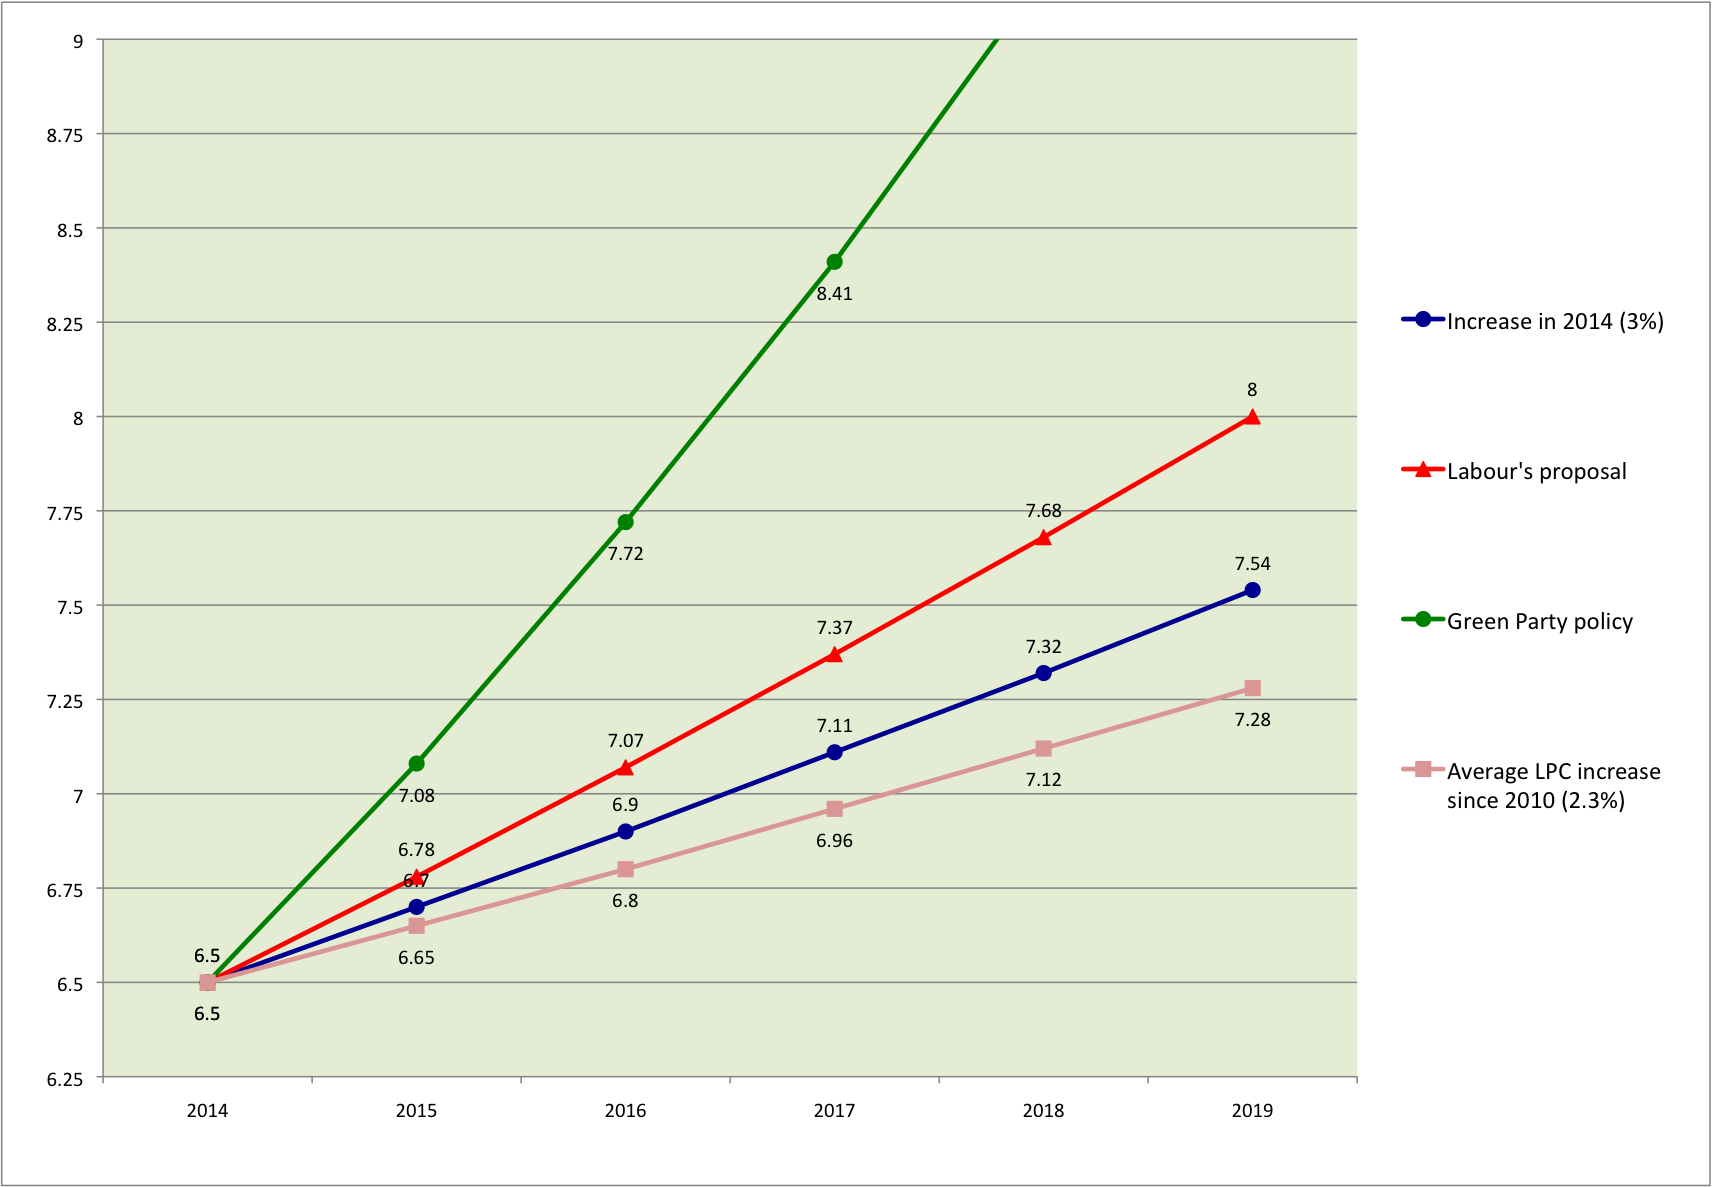
On the question of the rate, I find myself agreeing strongly with Andrew Harrop and – quite possibly for the first and last time ever – Iain Dale. With the NMW at £6.50 per hour from next month, the pledge of £8.00 per hour by 2020 equates to a steady annual increase of 4.25 per cent. Which is not massively above this year’s increase of 3 per cent, or even (what I’m told is) the average annual increase since 2010 of 2.3 per cent.

As the following chart shows, if this year’s slightly more generous increase of 3 per cent were to be replicated in each of the next few years – that is, the sort of rate of increase that George Osborne has said he would be happy with – the NMW rate would be £7.54 from October 2019, just 46 pence per hour below what it would be under Labour’s new proposal. Indeed, at that rate of increase, the NMW rate would reach £8.00 per hour in October 2021, just two years later than Labour now proposes. And Labour’s proposal looks rather pathetic against the Green Party’s far more ambitious policy of an NMW rate of £10.00 per hour by 2020. (I don’t think anyone knows what the Liberal Democrats would like the NMW rate to be in 2020).

NMW2

So, while certainly nothing to be sniffed at, the ‘£8.00 per hour by 2020’ pledge is hardly radical. At least, not in terms of the NMW hourly rate.

However, Miliband’s announcement does represent a radical break away by Labour from the long-standing political consensus that the NMW rate is set not by politicians, but by the ‘independent’ Low Pay Commission. George Osborne crudely tossed this 15-year-old political pact aside in January, when he let it be known that he would be content with a rate of £7.00 per hour. But, presumably out of fear of upsetting the TUC and trade unions, Labour has stuck with it. Until now.

This more radical aspect of the move seems to have gone unnoticed by most commentators, with the notable exception of the CBI which, together with the TUC, has dominated the Low Pay Commission (and therefore the NMW rate) since 1999. “A move to a politicised US-style system is not in the interest of companies or workers”, said the CBI in its response. Well, that depends. But it’s probably fair to say that the move is not in the immediate best interests of the CBI, which would no longer have quite the say on the setting of the NMW rate that it does now.

Like Andrew Harrop, I’d like to see Labour go a lot further and faster than £8.00 per hour by 2020. More particularly, I’d like to see the NMW rate brought up to at least 60 per cent of median earnings by 2020 at the very latest, not some time afterwards (as the detail of Labour’s proposal suggests). And I’d like to see Statutory Maternity & Paternity Pay raised to parity with the NMW by 2020.

But at least now we are talking openly about what the NMW rate should be, rather than leaving it to be fixed by TUC and CBI officials behind closed doors. And, believe me, that is pretty radical. The TUC may have publicly welcomed Miliband’s announcement this week, but I suspect it did so through gritted teeth. Certainly, the CBI is by no means alone – as this blog post by the New Policy Institute illustrates.

So, over the coming months, Miliband and his team are likely to come under intense pressure – from both sides.

With many thanks to Ravi Subramanian of UNISON, whose tweet of his own graph prompted me to write this post.

MoJ’s new line on ET fees as spurious as the old one

As if further proof were needed, the latest set of quarterly tribunal statistics – released by the Ministry of Justice on Thursday – confirm the dramatic impact of the employment tribunal (ET) fees introduced in July last year. For the third quarter in a row, the number of new ET cases is down by 65 per cent or more, compared to the same quarter a year ago. Over the nine months immediately prior to the introduction of fees, 44,000 employers had an ET case brought against them. But over the nine months up to June 2014, just 15,750 did.

As can be seen from the following chart, this is unquestionably a sudden and dramatic decline. Back in March 2013, the Department for Business, Innovation & Skills (BIS) noted that ET cases are “relatively rare”. They’re a lot rarer now.

Chart 1: Single claims/cases & multiple claimant cases (= total number of respondent employers), April 2012 to June 2014

casesSource: Table C1 of Annex C to Tribunal Statistics: April to June 2014, Ministry of Justice, September 2014.

Think of it this way: on average, each of the UK’s 1.21 million employers now faces an ET case just once every 58 years.

In the face of such evidence, the Ministry of Justice now seems to have abandoned its laughable initial line that this pattern is no more than a long-term downward trend. Conservative ministers such as Matt Hancock now proudly acknowledge the scale and suddenness of the decline, but seek to suggest it is no cause for concern as all the thousands of cases ‘lost’ to fees since July 2013 are simply vexatious or spurious claims that should not have been brought anyway.

Until the release of this week’s set of tribunal statistics, this was not an argument that was readily susceptible to disproof by analysis or chart, as that requires data on claim/case outcomes and – due to the time taken to process cases through the system – such outcome data lags at least two quarters behind that on new claims made. But the latest quarterly data – relating to the period April to June this year, so up to almost one year after the introduction of fees – allows us to start putting the new ministerial line to the test. For we can be reasonably confident that the great majority of the claims resolved in this quarter will have been issued after July 2013, not least because the dramatic fall in the number of cases has reduced the average time taken to resolve most types of claim.

If ministers are right, and fees have simply cut out all the vexatious and spurious claims, but have had no effect on access to justice by workers with meritorious claims, we would expect to see substantial shifts in the proportion of cases that are ultimately successful (whether at a hearing, by a default judgment, or through settlement), or unsuccessful. Indeed, we would expect successful claims to be heading towards 100 per cent, and unsuccessful claims towards zero.

So, what does the this outcome data tell us? Well, the following chart compares outcomes in the period April to June 2014, to the same quarter a year ago (i.e. immediately prior to the introduction of fees), and to previous full years. And from this it is clear that the introduction of fees has had no significant impact on outcomes (at least, not yet). Whilst the proportion of successful claims has increased slightly since the same quarter a year ago, from 13 per cent to 17 per cent, it’s still no higher than in any full year since 2007-08. And the proportion of unsuccessful claims is down, but only marginally so. (Note that the only significant changes evident in the chart – those in the proportion of cases settled by Acas, and withdrawn – not only cancel each other out, but pre-date the introduction of fees in any case).

Chart 2: Outcomes of ET claims (singles & multiples).

outcomesSource: Table 2.3 in Tribunal Statistics: April to June 2014 (Tables), Ministry of Justice, September 2014.

In short, not only is there no evidence whatsoever to support the new ministerial line – hardly a unique occurrence under this evidence-averse government – but the only available evidence shows it to be a pile of pants.

I imagine that some in government (and elsewhere) will try to claim that it is still too early to tell. But that is a weak argument that will get ever weaker with the release of each new set of quarterly tribunal statistics.

Or, as Alice might have said, spuriouser and spuriouser.