Since October 2013, when the UNISON legal team forced a reluctant Ministry of Injustice to cough up astonishing figures for the number of ET claims made in the previous two months, much has been written and said – not least by yours truly – about the impact of the ET fees regime introduced on 29 July that year. Most of this comment has focused on the sudden, substantial and sustained fall in the number of claims/cases, evident from the Ministry’s quarterly tribunal statistics, but over the last year or so attention has also been given to the seemingly related impact on claim outcomes. In short, it is now increasingly clear not only that the fees have deterred a very large number of potential claims/cases, but also that, on average, those claims ‘lost’ to fees were of greater merit than the claims that have not been deterred by the fees since July 2013. Yet ministers continue to assert, without evidence, that only ‘vexatious’ or “questionable” claims have been deterred by the fees.
In this post, I try to summarise – using some simple charts – what I see as the most important data for assessing the impact of fees on workers’ access to justice. And, in doing so, I will expand on my submission to the current inquiry into court and tribunal fees by the Justice select committee of MPs.
I strongly recommend that you read this post in conjunction with the excellent House of Commons library briefing paper, written by the excellent Doug Pyper and Feargal McGuinness, and published last month. And you might also want to read the submissions to the Justice committee’s inquiry from the Fawcett Society, the Law Society, Maternity Action, the President & Regional Employment Judges (England & Wales), the TUC, the Equality & Human Rights Commission (EHRC), and Working Families. The submission by Working Families includes this case study of what justice secretary Michael Gove would call ‘rough justice’:
Camilla, pregnant and until very recently working 30 hours per week as a hotel cleaner on a zero-hours contract, contacted the Working Families legal helpline in 2015 after being summarily dismissed for taking time off work due to a pregnancy-related illness. The helpline team considered Camilla to have a strong claim for unlawful pregnancy-related dismissal, but she was unwilling to risk up to £1,200 of her savings on issuing and pursuing a tribunal claim. Not without difficulty, Camilla had managed to save just over £3,000 to cover the extra expense she knew would come with having a baby – not least because she would receive only the statutory rate of maternity pay (just 60% of the National Minimum Wage) while on maternity leave. And those savings meant that Camilla would not be eligible for any remission of the tribunal fees.
The impact of fees on ET claim/case numbers
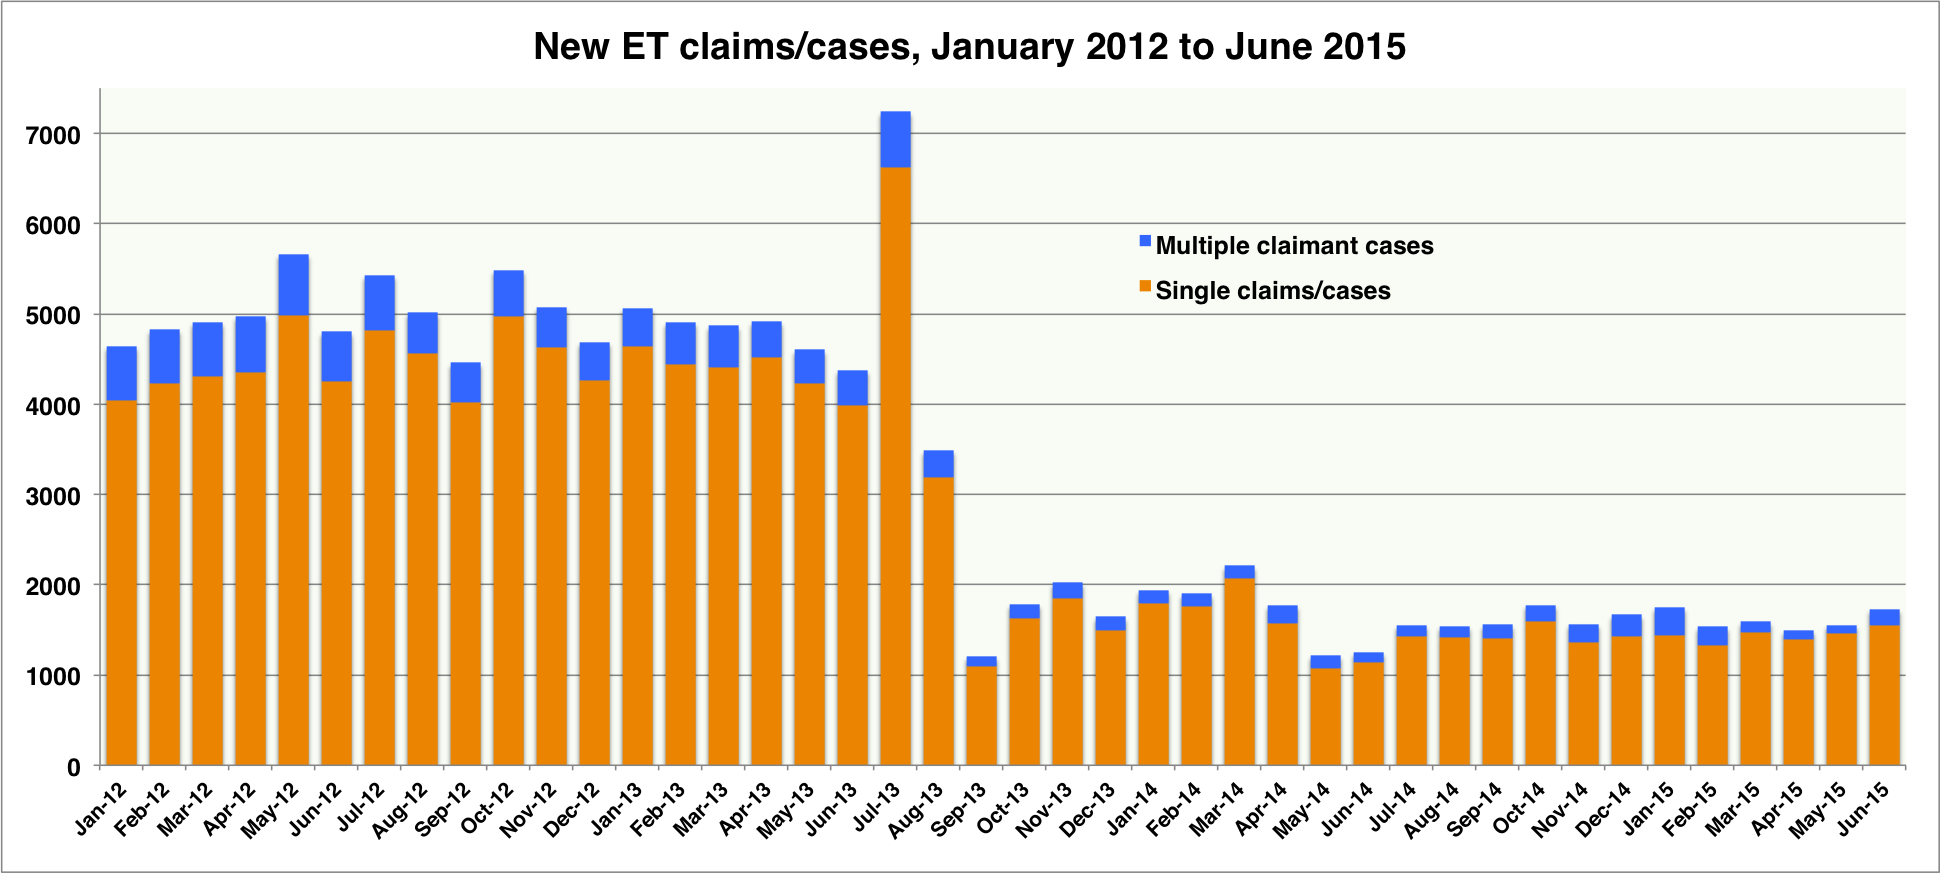
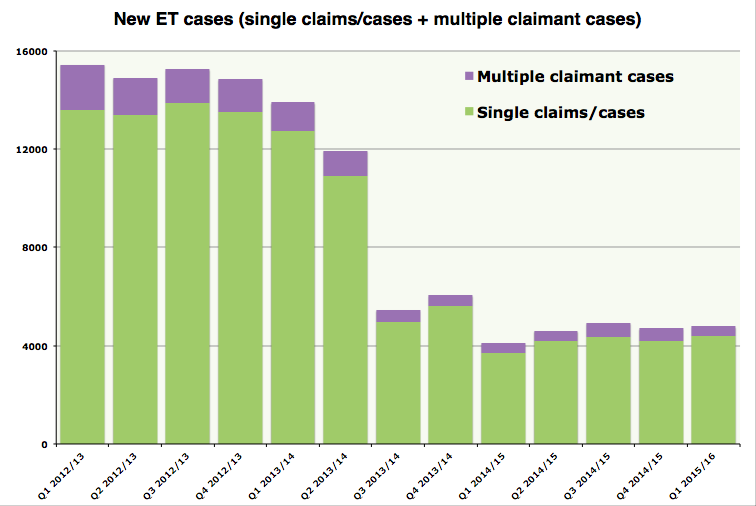
To fully understand the impact of fees on access to justice, it is important to understand that there are two different types of ET case: (a) single claims/cases brought by individual workers; and (b) multiple claimant cases involving tens, hundreds or even thousands of workers, each with an identical (or very similar) claim against the same employer. For example, in 2012-13 – the last full year before fees – there were 54,704 single claims/cases, and 6,104 multiple claimant cases involving a total 136,837 claimants, brought against an overall total of 60,808 employers (give or take some single claims brought against the same employer).
Most press and media reports about ET claim/case numbers misleadingly cite the grand total number of claimants (i.e. 54,704 + 136,837 = 191,541 in 2012-13), but that figure gives a grossly inflated impression of the ET system’s workload as, in most multiple claimant cases, the system will only need to determine one or a handful of lead claims. It is far better to focus on either the total number of cases (i.e. 60,808 in 2012-13) or, better still, the number of single claims/cases.
Not only is this the most meaningful measure of the ET system’s varying workload – and, indeed, the measure now favoured by the Ministry of Justice – but, as the vast majority of multiple claimant cases in recent years have been equal pay claims brought against local authorities and NHS trusts, it is also the most relevant measure when considering the impact of ET claim/case numbers on private sector employers. In that context, it is also worth bearing in mind that approximately one-third of all single claims/cases are also brought against public or voluntary sector employers.
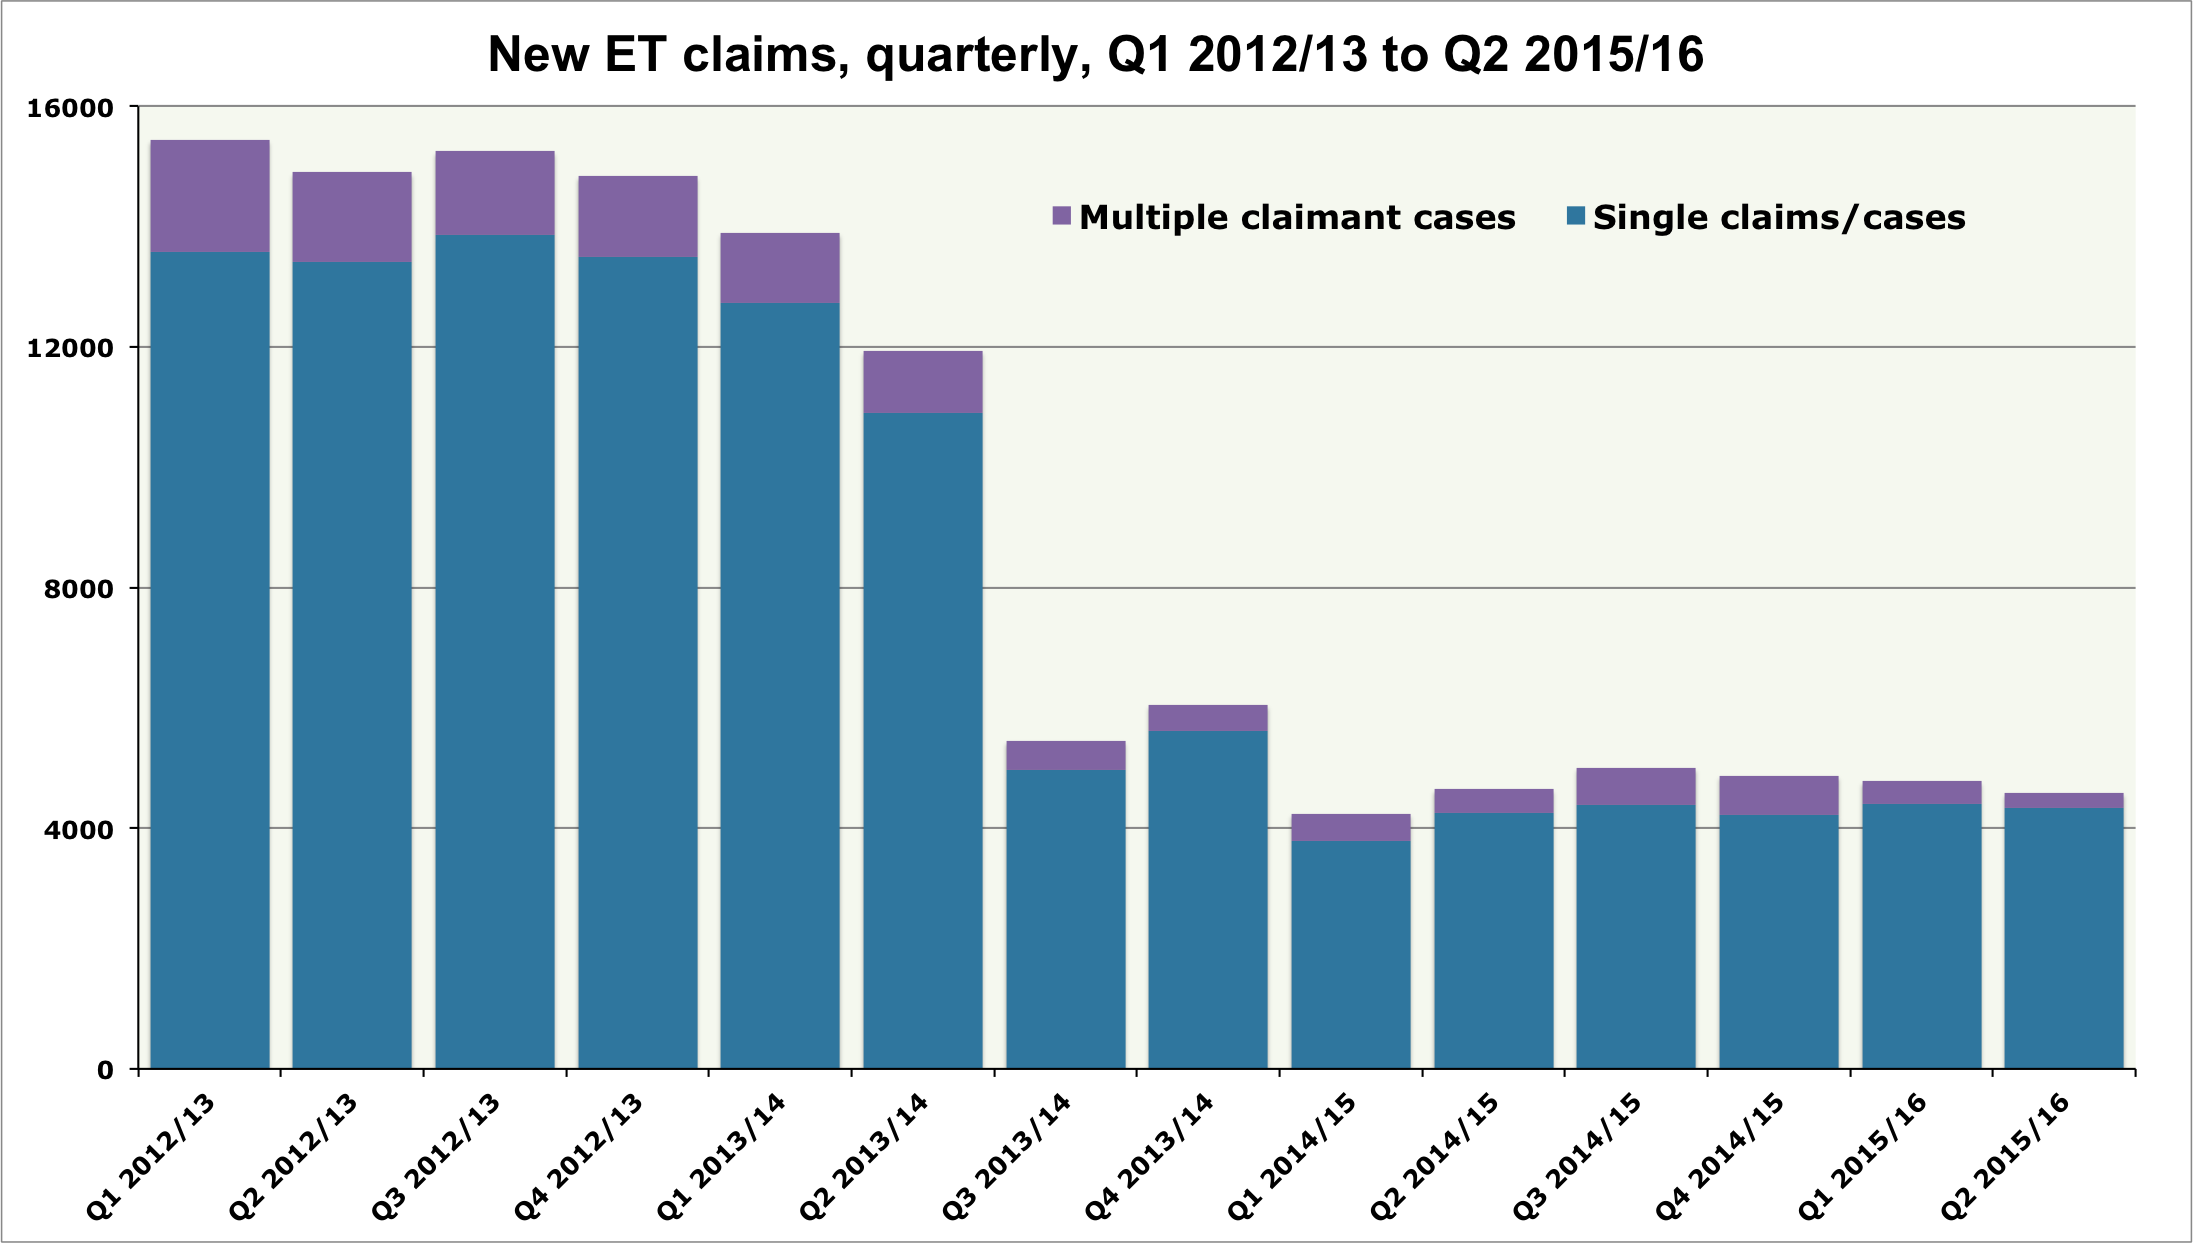
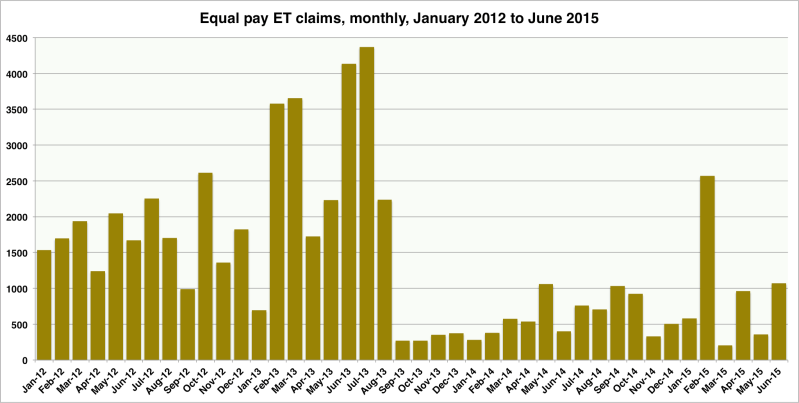
In fact, and as the following chart shows, since July 2013 there has been a substantial and sustained fall both in the total number of new cases, and in the number of new single claims/cases. (The unusually high number of claims/cases in July 2013 was undoubtedly due to some claims being submitted earlier than they would otherwise have been, in order to beat the introduction of fees on 29 July).
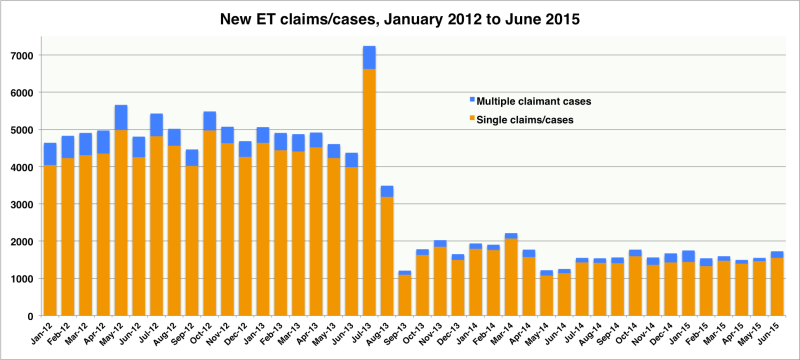
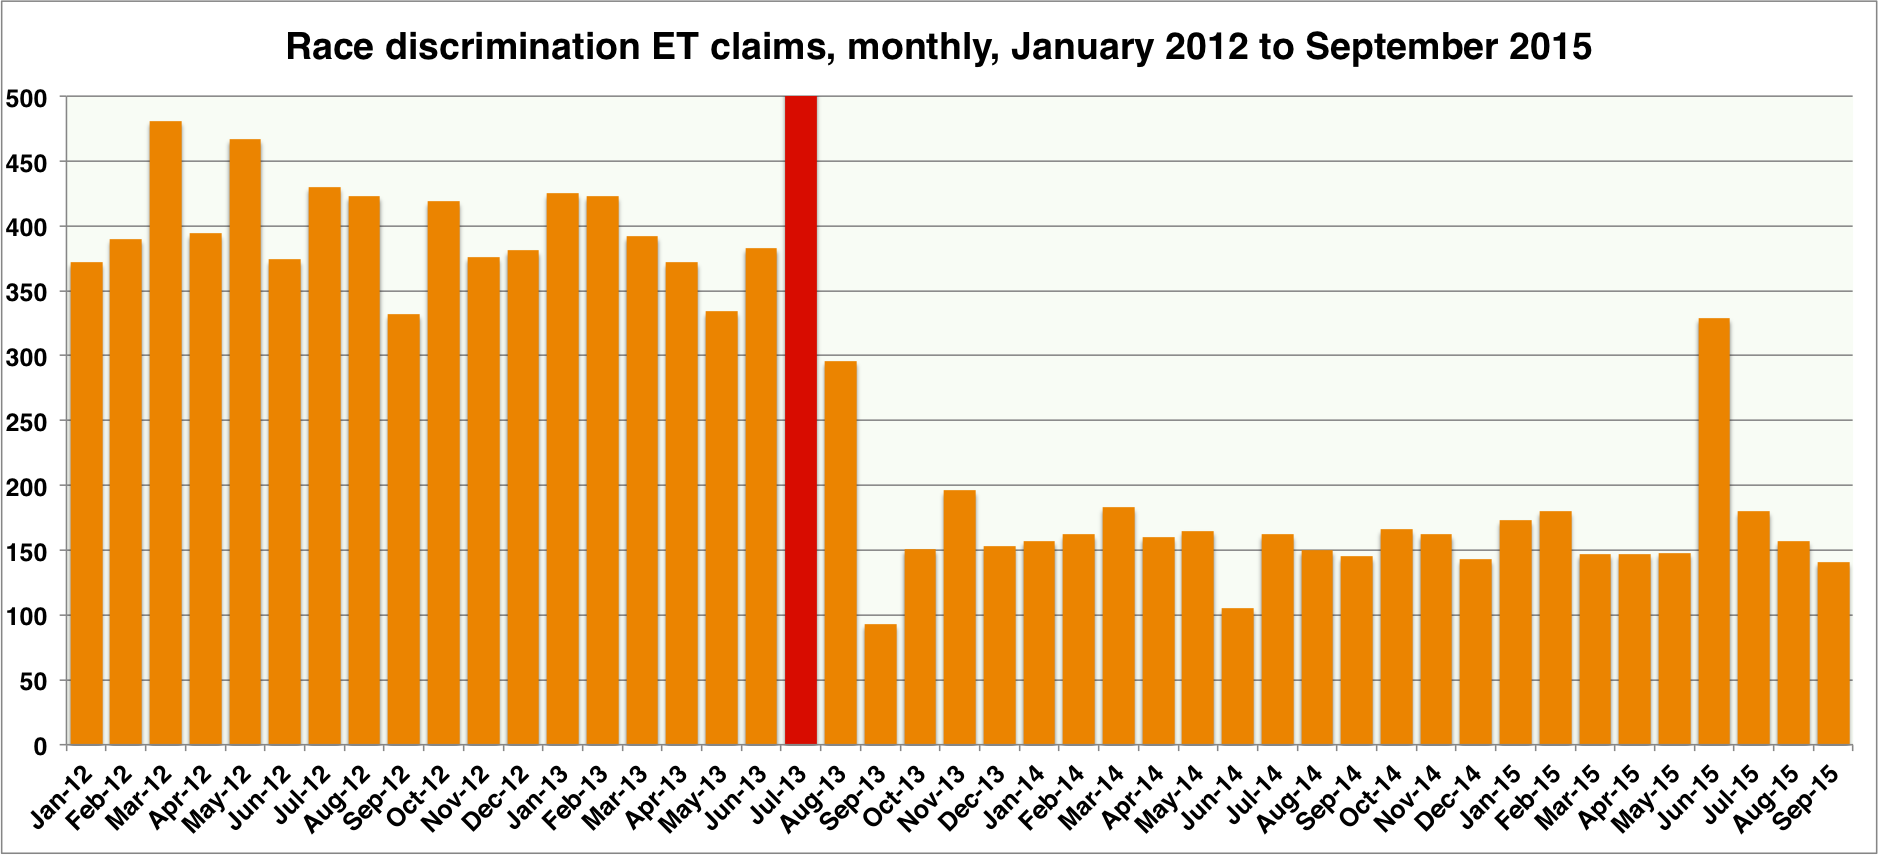
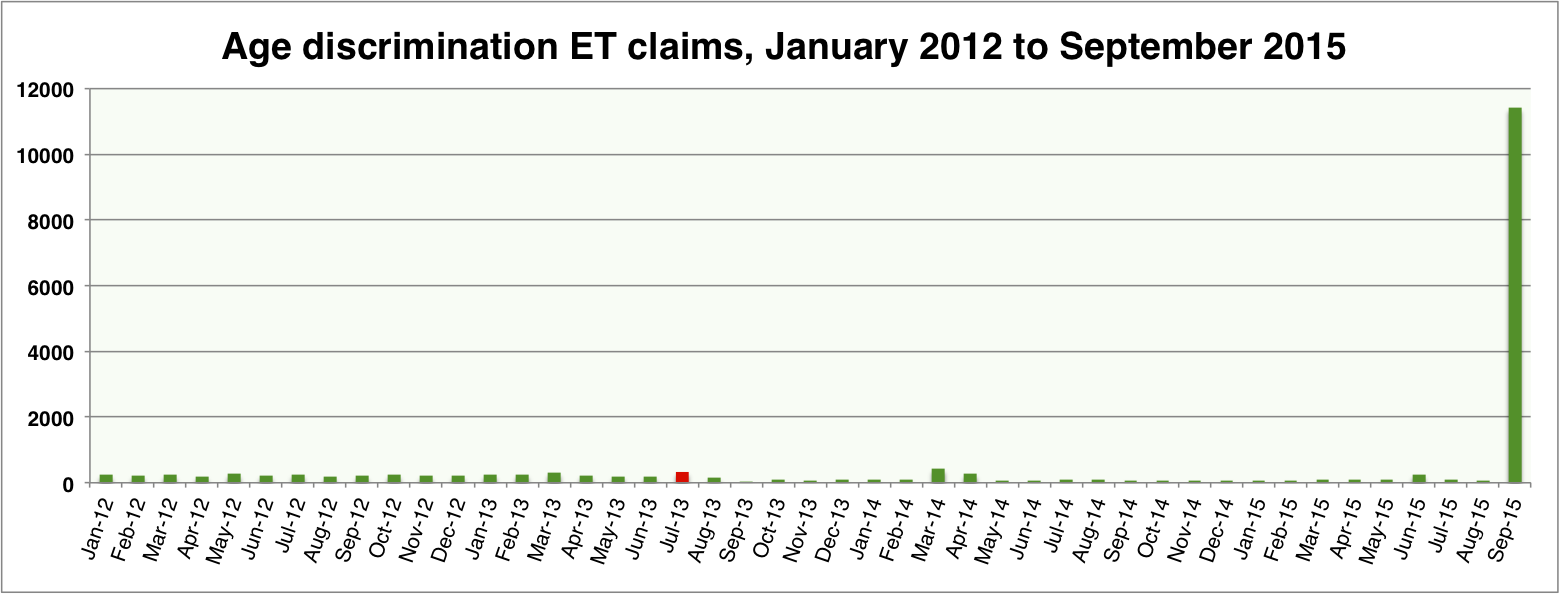
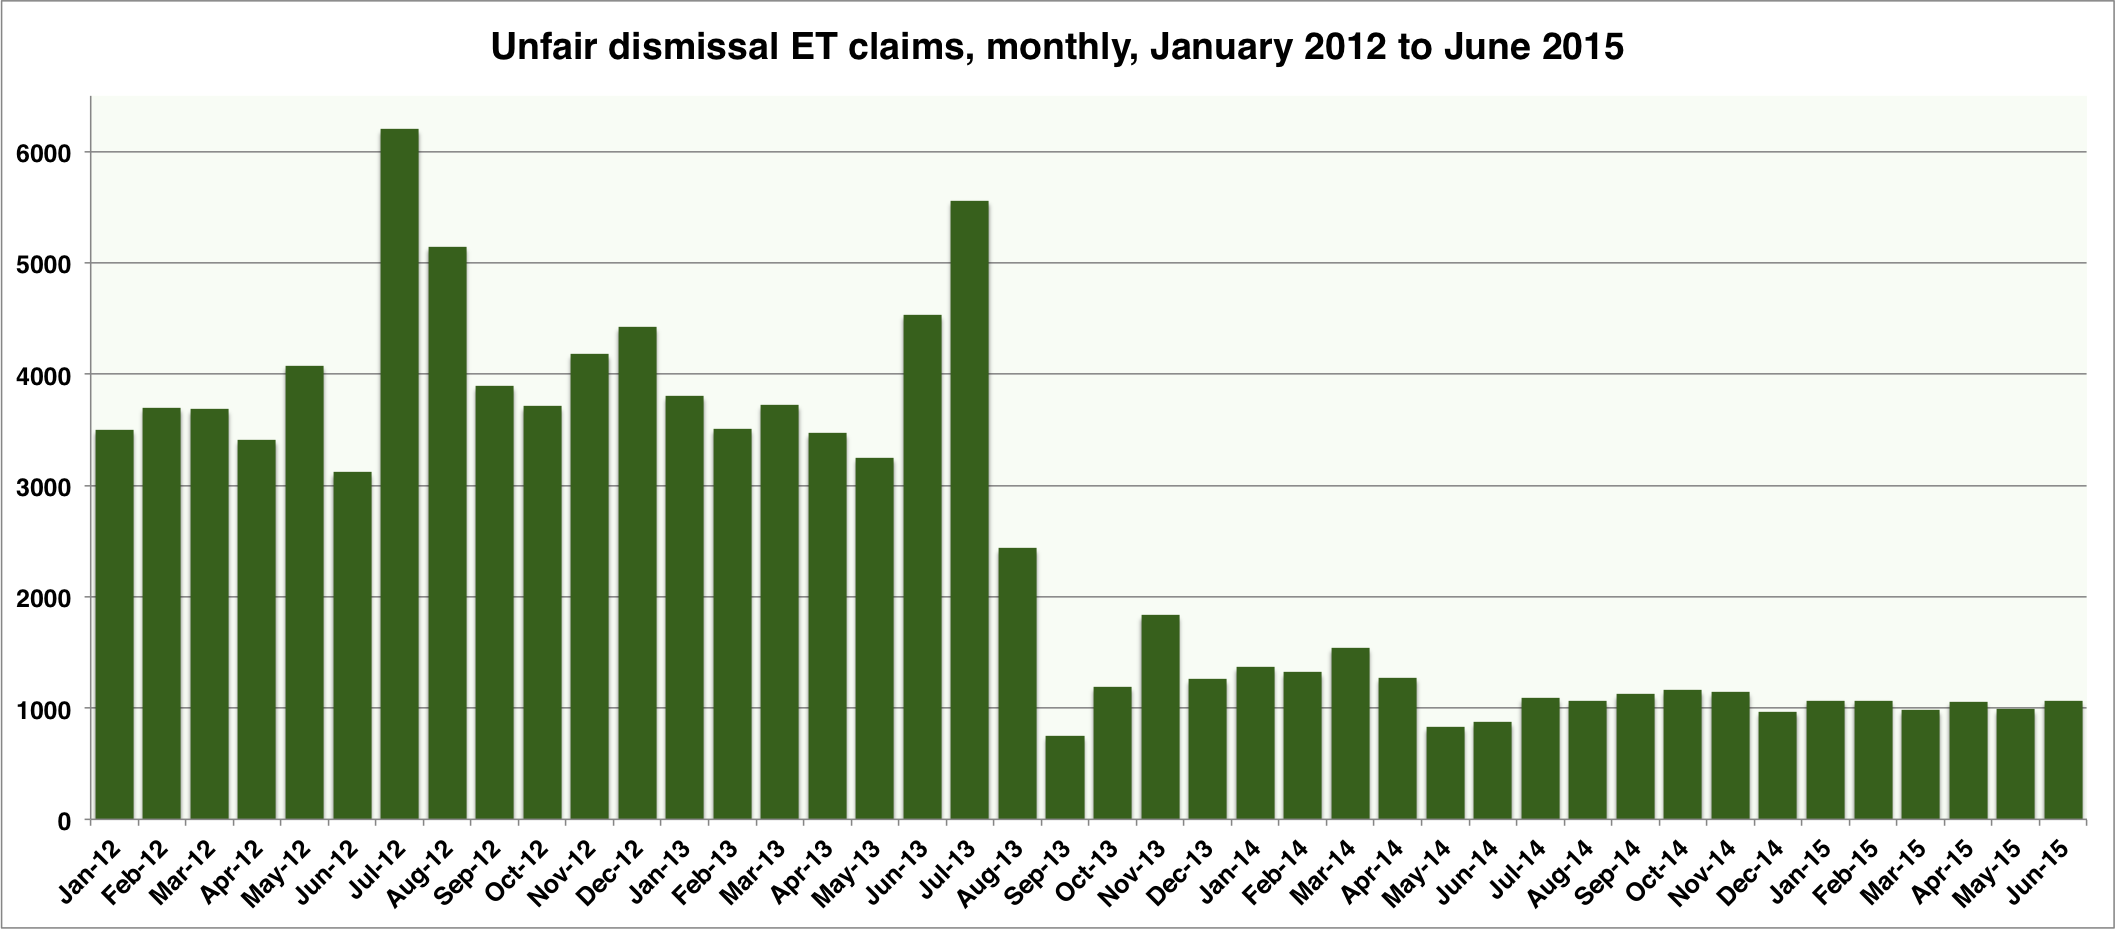
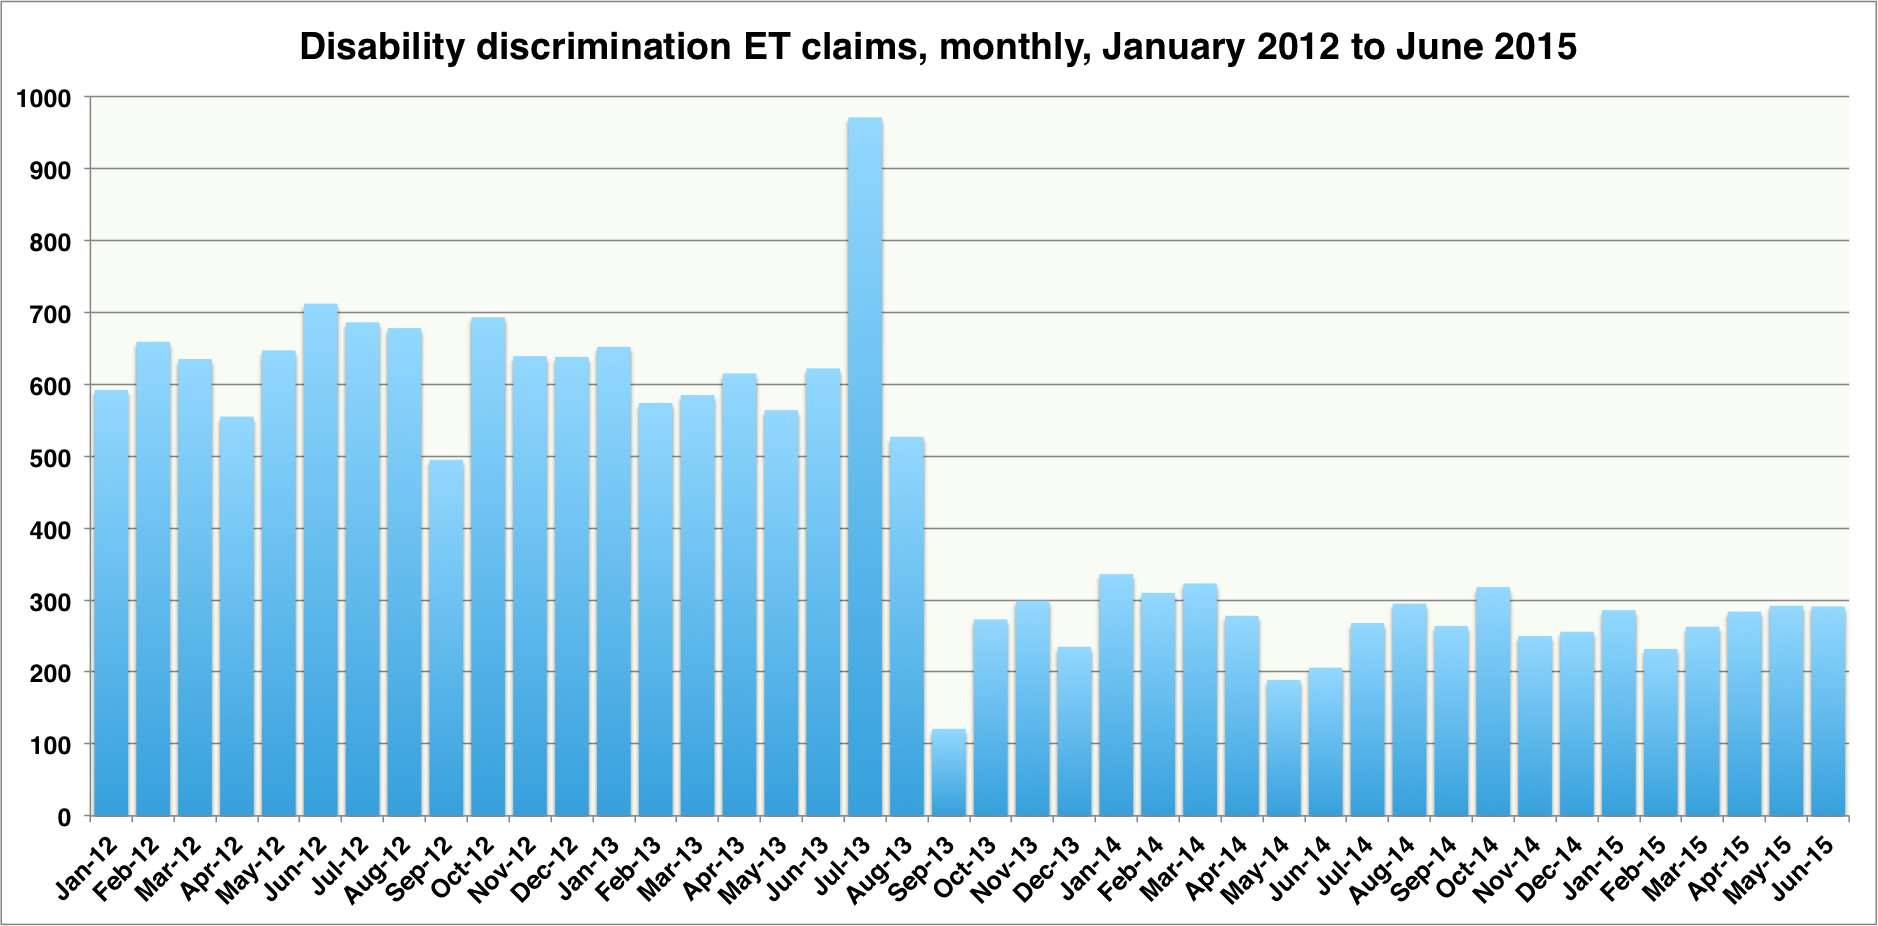
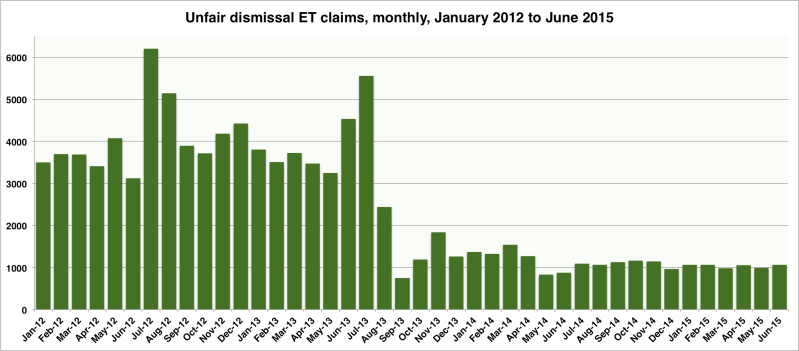
Much the same pattern – of claim/case numbers remaining steady or declining no more than marginally between January 2012 and June 2013, then plummeting from August 2013 onwards – can be seen if we look at some of the major jurisdictions.

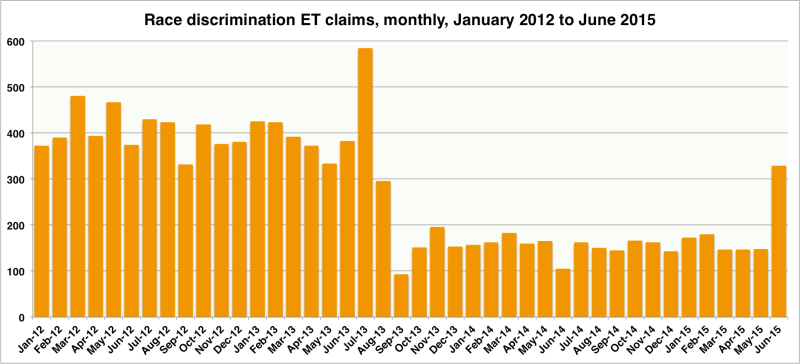

Equal pay and sex discrimination are two of the few jurisdictions in which there was an upwards trend in claim numbers, prior to the introduction of fees in July 2013.

While the officially stated objectives for the fees regime do not include ‘deterring potential claimants’, it is (and always was) abundantly clear that this was in fact the principal objective of ministers. For example, in November 2014, the then justice secretary, Chris Grayling, stated that, by introducing fees, the Coalition government was “trying to deal with a situation where it was too easy to go to a tribunal and where employers, often good employers, were easy prey for questionable claims”. And in June 2015, the current justice secretary’s legal counsel, David Barr QC, told the Court of Appeal that the ‘policy problem’ that fees were intended to address was that “there were increasing numbers of [ET] claims and the existing model was unsustainable.”
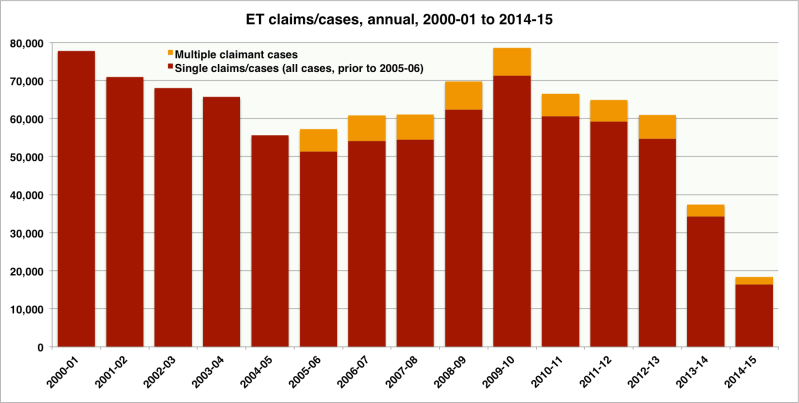
In fact, as the following chart shows, having flat-lined in the mid-2000s, and then risen to a peak in 2009-10, at the height of the wave of business failures and redundancies that followed the onset of economic recession in late 2008, the number of single claims/cases was already falling when ministers announced their intention to introduce ET fees in November 2011. And, by the time fees came into force in July 2013, the (modest) “historic downward trend” in single claim/case numbers now cited by ministers as an alternative to the introduction of fees as an explanation of the decline in claim/case numbers was already well established. Indeed, by that time, claim/case numbers had fallen back to the pre-recession, record low level of the mid-2000s.
The number of claims/cases ‘lost’ to fees
As is clear from the above charts, the introduction of fees in late July 2013 had an immediate, substantial and sustained impact on ET claim/case numbers: in August 2013, the number of new claims/cases fell off a cliff, and has not recovered since. In the six months up to 31 March 2014 – i.e. up to immediately prior to the introduction of Acas early conciliation in April 2014 (see below) – new ET cases (single claims/cases + multiple claimant cases) were down 62% on the same period in 2012-13, from 30,095 to 11,508. Unfair dismissal claims were down by 64%, sex discrimination claims by 80%, and equal pay claims by 84%. In the words of Lord Justice Underhill in the Court of Appeal in July 2015:
It is quite clear … that the introduction of [ET] fees has had the effect of deterring a very large number of potential claimants.
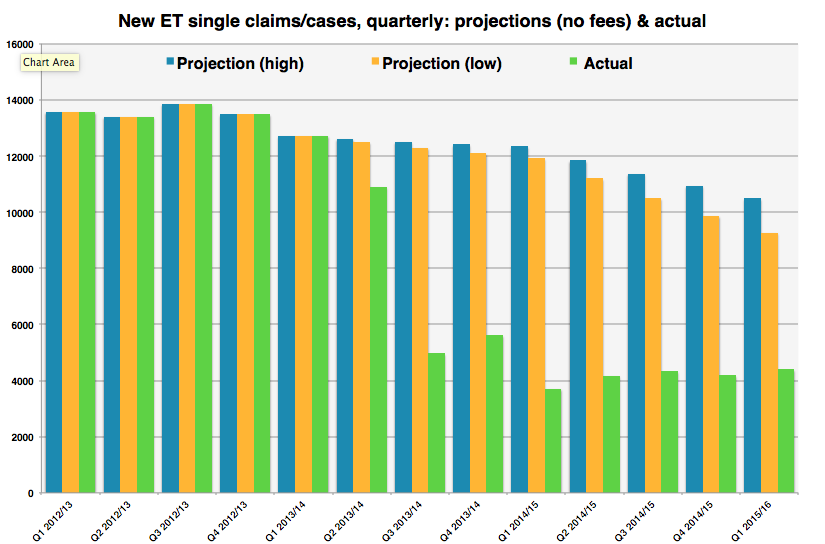
Indeed. And that “very large number” is easily quantified, by comparing the actual number of single claims/cases against the number we could have expected, had fees not been introduced in July 2013. To do so, we simply need to generate projections allowing for (a) the “historic downward trend” in case numbers that began in 2010/11, but which ministers either failed to spot or ignored in 2012, when deciding to introduce fees; and (b) the introduction of Acas early conciliation, which was intended to bring about a 17 per cent reduction in the number of claims, in April/May 2014.
Clearly, that “historic downward trend” may not have continued at the same rate (or even at all) in recent quarters, and the actual impact of Acas early conciliation appears to have been more modest than intended – the combined impact of any remaining downward trend and the introduction of early conciliation has been an annual rate of decline of just 15.4%. So the following chart sets out two alternative projections (one low, one high) of single claim/case numbers.

For the ‘low’ estimate (Projection A), I have assumed that claim/case numbers continued to decline at an annual rate of 6.3% over all eight post-fees quarters, and that the introduction of Acas early conciliation caused a further 17% reduction over the last four quarters. And, for the ‘high’ estimate (Projection B), I have assumed that claim/case numbers declined by 3% over the first four quarters, and then by 15.4% over the last four quarters (i.e. the same rate as the actual decline due to the combined impact of Acas early conciliation and any remaining ‘historic downward trend’).
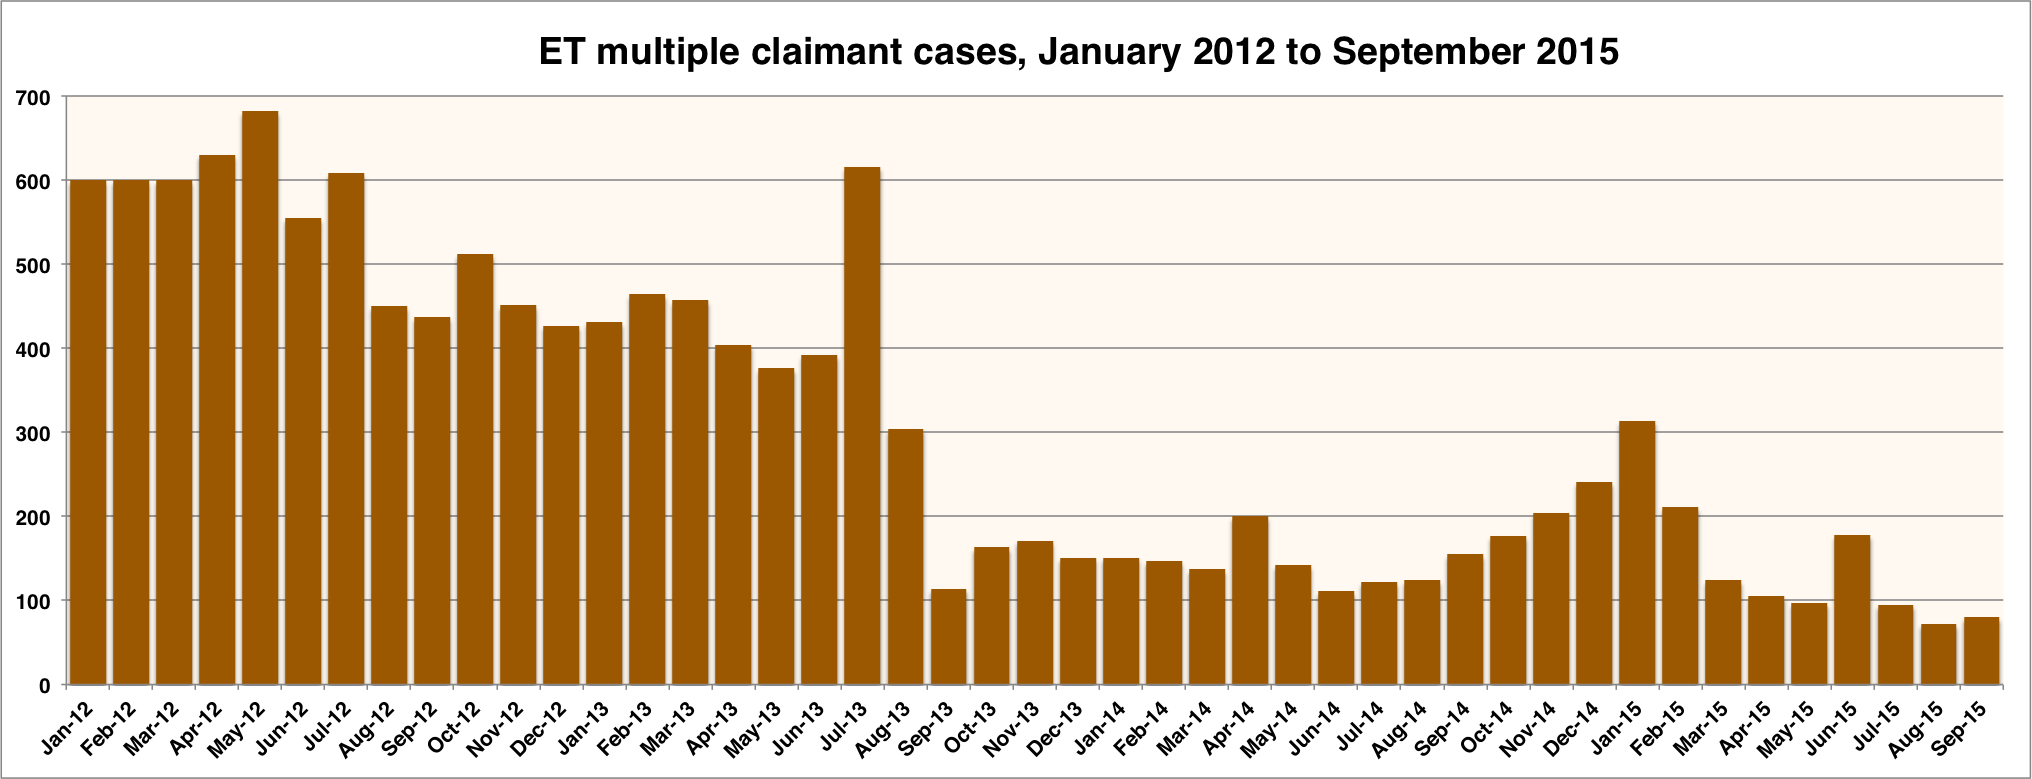
According to these calculations, as of 30 June 2015, the “very large number” of potential single claimants deterred by and so ‘lost’ to fees was somewhere between 47,350 and 52,200, and continues to rise by some 5-6,000 every quarter. Furthermore, based on historic (i.e. pre-July 2013) case outcome trends, about 80% of those individuals – four out of every five – would have obtained a favourable judgment or settlement, had fees not been introduced. (Note that these figures do not include any claimants in multiple claimant cases ‘lost’ to fees. The number of such MCCs has also declined since mid-2013, but that decline may well be due to factors other than the fees).
How many of the claims/cases ‘lost’ to fees were meritorious
As it is pretty much indisputable that – after allowing for the “historic downward trend” in claim/case numbers and the introduction, almost a year after fees, of Acas early conciliation – some 47-52,000 single claims/cases have been ‘lost’ to fees (as of 30 June 2015), the key outstanding question is: how many of those ‘lost’ claims/cases are likely to have been meritorious?
There is of course no way of knowing for sure. Because – as noted recently by the Department for Business, Innovation & Skills – “only an employment tribunal can determine whether unlawful discrimination or unfair dismissal has occurred.” And, by definition, none of the 47-52,000 single claims/cases ‘lost’ to fees will ever go before a tribunal. (It is worth noting that this was a key factor in the failure of UNISON’s two applications for judicial review – the courts said they needed to see individual cases of ‘justice being denied by the fees’, but by definition cases in which the claimant has been deterred by fees yet a tribunal has found their claim to be meritorious simply don’t – and can’t – exist).
However, in July this year, when giving oral evidence to the Justice committee of MPs on the work of his Ministry, justice secretary Michael Gove appeared to suggest that none of these 47-52,000 single claims/cases ‘lost’ to fees were meritorious, stating:
“There is no evidence yet that the bar being set at a high level has meant that meritorious claims by people who feel they’ve been discriminated against aren’t being heard.”
Yet it simply defies logic to think that the impact of ET fees could have been so precisely calibrated by the Ministry in 2012 that some 47-52,000 unmeritorious claims/cases have been deterred by fees in just two years, without even one potential claimant with a meritorious case being so deterred. Moreover, the available evidence on claim/case outcomes flatly contradicts the justice secretary’s assertion that none of the 47-52,000 single claims/cases ‘lost’ to fees were meritorious.
Were it the case that all (or even just most) of the 47-52,000 single claims/cases ‘lost’ to fees were without merit, then we could expect the overall success rate of claims to have risen substantially. And, as the average ‘age’ of concluded cases is about nine months, this effect would have become clearly evident in the official outcome statistics from at least the first quarter of 2014/15 onwards, if not earlier.
Yet, as the following chart shows, far from rising, the overall success rate has fallen in each of the last five quarters, from 79% in 2013/14, to just 62% in the last quarter of 2014/15. In the first quarter of 2015/16 (April to June 2015), the figures for which were published last month, the overall success rate did leap to 75%. However, this figure is substantially inflated by unusually high proportions of (i) equal pay claims being conciliated by Acas or withdrawn (80%, compared to 40% in the same quarter in 2014/15); and (ii) unfair dismissal claims being conciliated by Acas (69%, compared to 32% in the same quarter in 2014/5). And, of course, outcome figures are given in terms of jurisdictional claims, not cases, so are easily skewed by one or two large multiple claimant cases. If we remove those two jurisdictions from the picture, then the overall success rate in the first quarter of 2015/16 falls to 62% – the same as in the previous quarter.

Now, it can be argued that the ‘overall success rate’ shown above is too broad a measure of ‘success’. And it is true that, while the great majority of withdrawn claims are withdrawn as a result of a settlement of the claim, this is not true of all cases. So the following chart shows more narrow definitions of both ‘success’ and ‘failure’, excluding claims conciliated by Acas or withdrawn. And, again, we can see that, from the first quarter of 2014-15, both the ‘success’ rate and the ‘failure’ rate have moved in the opposite direction to what could be expected, were all or even just most of the claims ‘lost’ to fees of little or no merit.
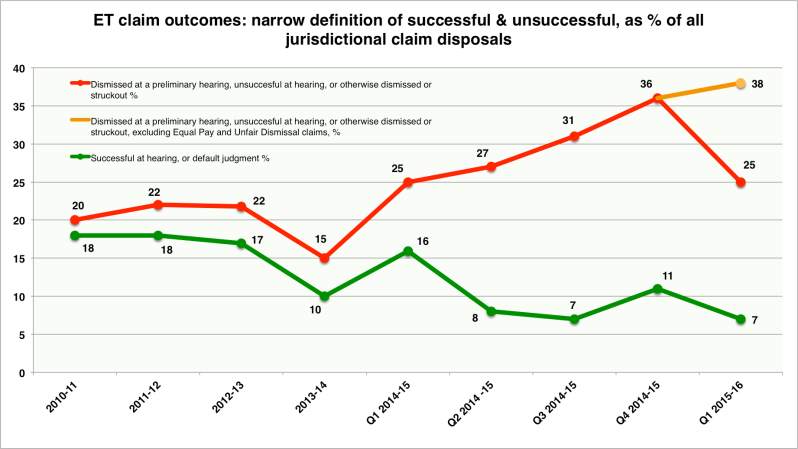
As with the more broadly-defined ‘overall success rate’, the figure for ‘unsuccessful’ claims disposed of in quarter 1 of 2015-16 is distorted by the unusually high rate of equal pay and unfair dismissal claims conciliated by Acas or withdrawn, so the orange line excludes these two jurisdictions.
Such analysis tends to confirm the view of experienced employment law practitioners that, by and large, it is the ‘high merit but low value’ claims/cases by relatively low-income workers that have been deterred by fees. Yet, in the words of one (respondent) lawyer, “the fees regime really isn’t preventing [speculative] claims with little merit” by high earners, who can “easily afford” the issue fee of £250 “in the hope of making a return on this investment.”
Other considerations
In addition to citing the “historic downward trend” in case numbers and introduction of Acas early conciliation as factors that might explain at least some of the dramatic fall in ET case numbers since July 2013, ministers have repeatedly suggested that some potential ET claimants have simply decided to issue the claim in the County Court, where issue and hearing fees are lower, instead of in the ET.
It is certainly possible that some single claims/cases have been displaced to the County Court. However, all but a few types of claim can only be brought in the tribunal and – while there is some anecdotal evidence of large multiple claimant cases having been brought in the civil courts instead of the tribunal – I am not aware of any actual evidence of such displacement of single claims/cases. Accordingly, there is no good reason to think that such displacement accounts for more than a very small proportion of the 47-52,000 single claims/cases ‘lost’ to fees since July 2013.
Ministers have also stated – repeatedly – that access to justice has been preserved by the existence of the fee remission scheme. A great deal has been said and written about the adequacy or otherwise of that fee remission scheme, but here I simply note that the theoretical availability of full or partial fee remission to claimants on a very low income – and with less than £3,000 of household savings – has patently not protected access to justice for the 47-52,000 individual claimants ‘lost’ to fees since July 2013. More particularly, it has not protected access to justice for the 80% (i.e. 38-42,000) of those men and women who – based on historic case outcome trends – we can reasonably expect to have obtained a favourable judgment or settlement, had fees not been introduced.
Conclusion
Even after allowing for a pre-existing (but modest) downward trend in claim/case numbers, and for the (intended) impact of the introduction of Acas early conciliation in early 2014, the introduction of prohibitively high claimant fees in July 2013 has deterred some 47-52,000 single claims/cases in just two years. All the available evidence – including individual case examples, the experience-based views of a large number of employment law practitioners, and the official statistics on claim outcomes cited above – strongly counters the Government’s apparent position that none of those 47-52,000 single claims/cases were meritorious. And, prior to the introduction of fees, no credible commentator ever suggested that two-thirds of all such claims/cases were “vexatious”, “bogus” or otherwise without merit.
Apart from the obvious detriment to the 47-52,000 individuals in question, this amounts to a significant diminution of the ‘deterrence’ value of the ET system, with an associated risk of increased incidence of unlawful employment practice by rogue and dinosaur employers. That is not in the long-term interest of law-abiding employers, who quite rightly expect a level-playing field on which to compete with business rivals.
Yet this avoidable damage to access to justice and the ‘deterrence’ value of the ET system has brought negligible financial benefit to the government. In 2014-15, net income from ET fees (after both remission and annual administrative costs of some £1.3m) was just £4.3m – less than half the £10m that, in 2012, the Ministry said it expected fees to generate each year. (There have of course been more substantial operational cost savings due to the two-thirds fall in case numbers, but such savings were never an officially stated objective for the fees).
In short, only an idiot would deny that the fees regime needs to be reformed. What that reform should look like, I will explore in a future post.