ET claims & fees: a few more charts (sorry)

If you feel that you’ve already seen enough charts detailing the evisceration of the employment tribunal system by fees in recent days, then this post is not for you. Go and watch some football or something.

For those still with me – Hi Mum! – I’ve been looking at the regional breakdown of single and multiple claims included in yesterday’s statistical release by the Ministry of Injustice. And they make for some striking charts that put in context all those anecdotes from employment lawyers of tumbleweed blowing through the corridors and hearing rooms of regional ET centres.

This is the North East, where the average monthly number of claims (singles and multiples) has fallen by 85.5 per cent, from 1,561 in the 18 months prior to the introduction of fees in July 2013, to just 227 in the six-month period October 2013 – March 2014:

ET North East

And this is the South West, where the average monthly number of single claims has fallen by 63 per cent, from 445 in the 18 months prior to the introduction of fees, to just 166 in the six-month period October 2013 – March 2014:

ET South West

This is Scotland, where the average monthly number of claims (singles and multiples) has fallen by 67.4 per cent, from 945 in the 18 months prior to the introduction of fees in July 2013, to just 308 in the six-month period October 2013 – March 2014:

ET Scotland

And this is Wales, where the average monthly number of claims (singles and multiples) has fallen by 71 per cent, from 404 in the 18 months prior to the introduction of fees, to just 117 in the six-month period October 2013 – March 2014:

ET Wales

And even London – with all those high-value discrimination claims from the City – is pretty much a wasteland, with the average monthly number of claims (singles and multiples) having plummeted by a staggering 88.5 per cent, from 7,952 to just 912:

ET London

But no need to worry as, according to the Ministry of Justice, this is all just a long-term trend, nothing to do with the fees regime introduced last July.

A long-term trend? Really? Let’s do a couple more charts. As suggested to me by Daniel Barnett, these show the rolling three-month average number of claims over the period March 2012 to March 2014. That is, each month’s figure is the average of that month and the previous two months. Such a rolling average smooths out the inevitable ups and downs from month to month, to give a more reliable indication of any longer-term trend.

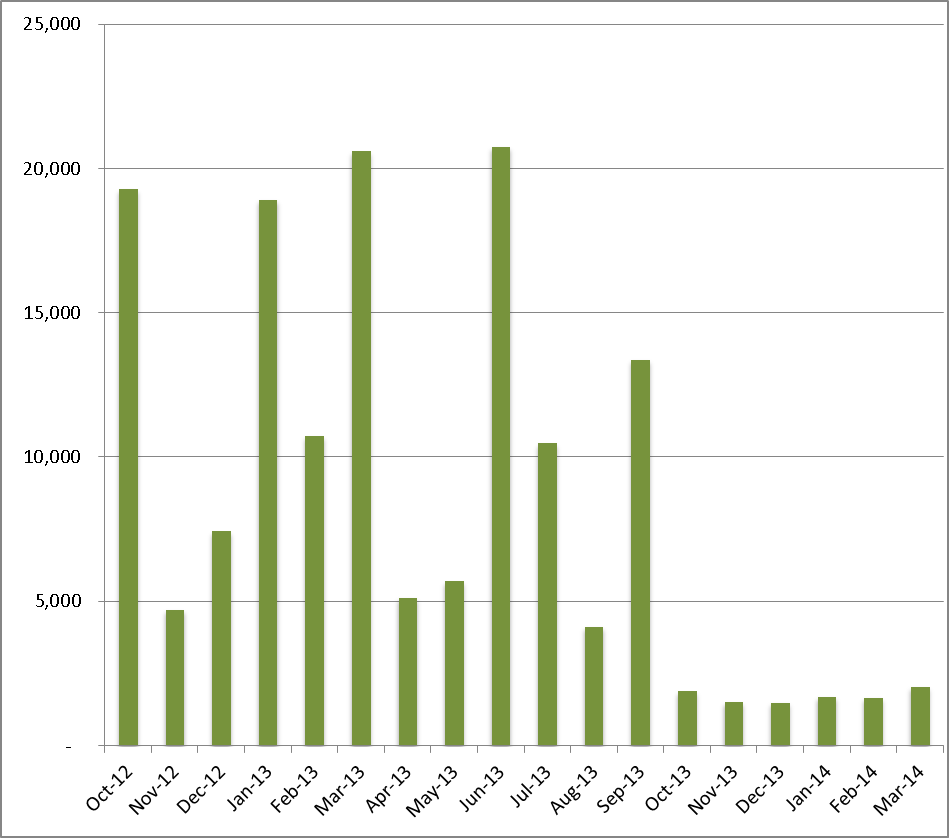
And this is what we get on single claims:

ET rolling singles

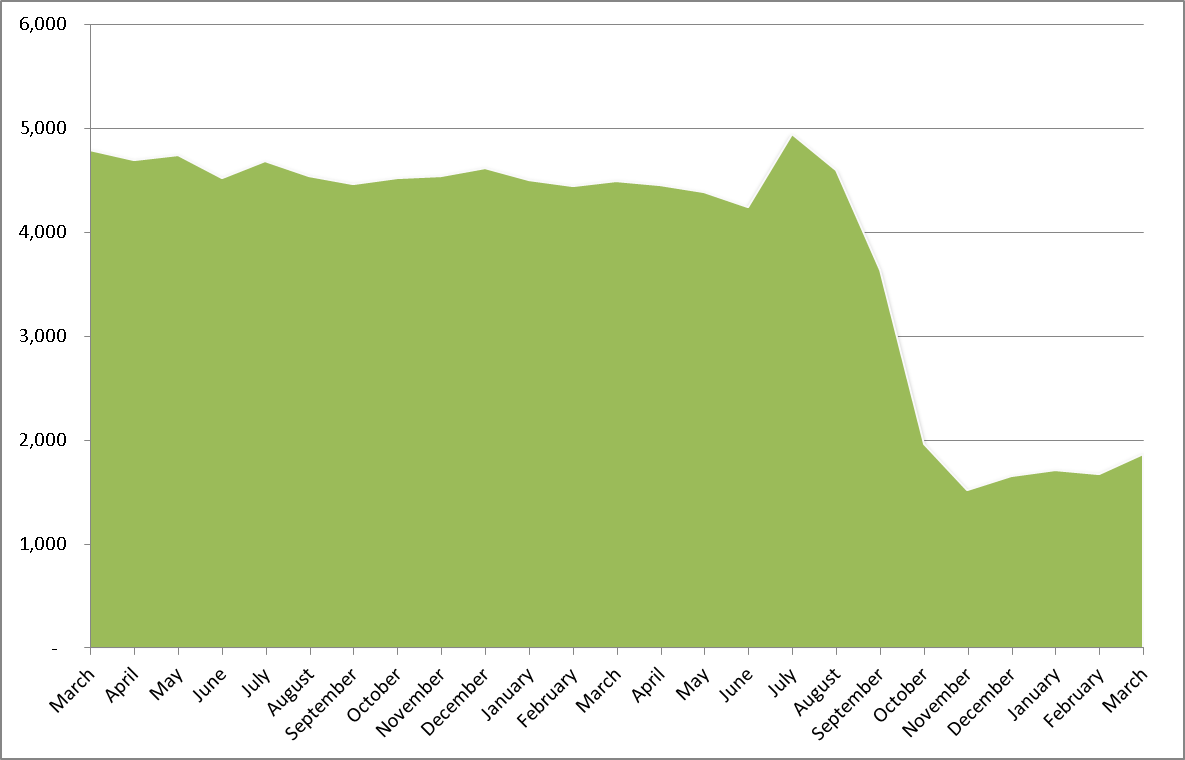
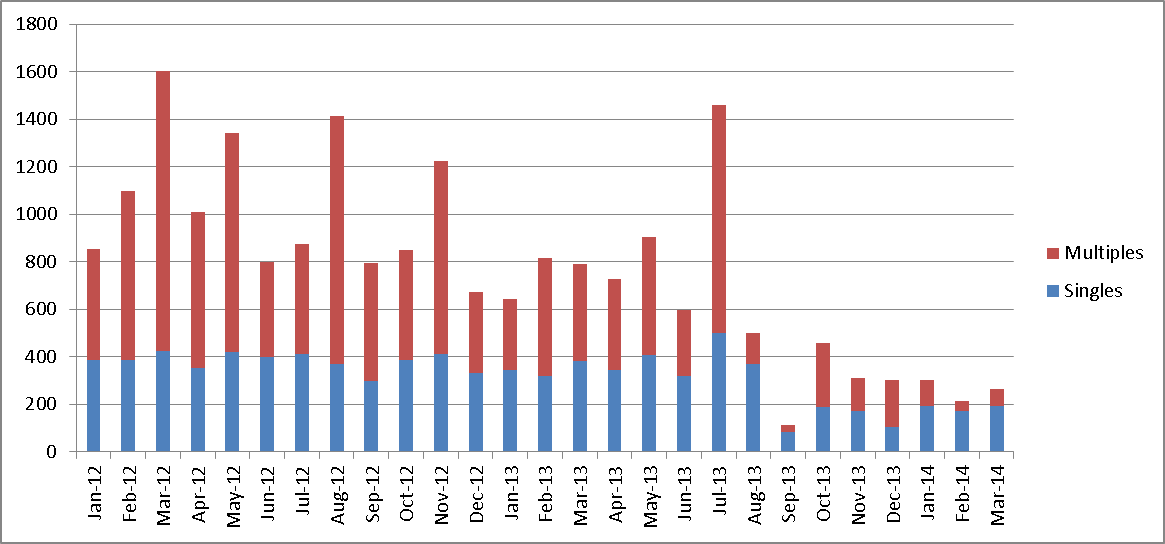
Does that look like a long-term trend to you? It looks more like a cliff-edge to me. And applying the same approach to multiple claims, we get this little shocker:

ET rolling multiples

Again, if that’s a long-term trend, then I’m a banana.

But if anyone in the Ministry of Injustice is reading this – unlikely, I know – and would like to send me or Sean Jones some alternative charts showing their long-term downward trend, we would be very happy to reproduce them here on Hard Labour. I have of course seen Figure 3 on page 8 of the Ministry’s commentary on the quarterly statistics, which purports to show a long-term downward trend in both single claims and multiple claims encompassing the drop in claims since July 2013, but actually shows no such thing.

First of all, by cramming five years of data into one very small chart, the Ministry makes it difficult to distinguish very long-term (but shallow) trends from shorter-term, steeper movements such as that since July last year. Viewed from the moon, the Great Wall of China looks like a smoothly curved line, but viewed from a helicopter it clearly wiggles all over the place.

In any case, in terms of multiple claims, the Ministry’s pathetic little chart simply shows a mountain range of fluctuations, with no discernible trend whatsoever since as long ago as early 2011 until … the autumn of 2013. Sure, there were a couple of higher peaks in 2009 and 2010, not replicated since, but then there was a little difficulty in the economy at that time.

As for single claims, yes there was a steady but shallow decline from the peak in mid-2009, right the way through 2011 and 2012.  Indeed, some of us tried hard (but failed) to get ministers to acknowledge that steady decline in 2012, when they were pushing through employment law and tribunal reforms predicated on allegedly explosive growth in the number of claims. But that shallow, long-term trend since 2009 does not begin to explain the cliff-edges shown in my (green) chart above.

Ironically, the Ministry’s chart leaves out the only type of case in which there was a significant downward trend in the 12 months prior to the introduction of fees: multiple claimant cases.  But, as the following chart shows, even that downward trend cannot conceal a marked acceleration of the fall in July 2013.

ET rolling multiple cases


ET fees: ball back in Lord Chancellor’s court

In February, when rejecting UNISON’s judicial review of the employment tribunal fees regime introduced last July – on the grounds that it was simply too early to reach a firm conclusion on the impact of the fees, the only available statistics being provisional figures for the month of September – the High Court noted that “if [these provisional figures] are anything like accurate, then the impact of the fees has been dramatic”. And the judges suggested that, should the Lord Chancellor’s optimism that the number of ET claims would soon bounce back to more ‘normal’ levels prove unfounded, then they would “expect the Lord Chancellor to change the [fees regime] without any need for further litigation”.

Within weeks, the accuracy of those provisional figures was confirmed, with tribunal statistics for the three-month period October to December (Quarter 3 of 2013/14) showing a dramatic fall in the number of ET claims by individual claimants, from an average of 4,460 per month in the nine months before the introduction of fees in July 2013, to just 1,000 in September, 1,620 in October, 1,840 in November, and 1,500 in December.

UNISON has since been granted permission to appeal to the Court of Appeal, but as of today the ball is back in the Lord Chancellor’s court, with the latest set of quarterly tribunal statistics – for the period January to March 2014 (Quarter 4 of 2013/14) – showing no significant rebound in the level of ET claims since December.

The headline number of ET claims, which includes both single and multiple claims and which was down 78 per cent in Quarter 3, was down again in Quarter 4, by 83 per cent compared to the same quarter a year ago. Based on past experience, this is the figure that will dominate reporting of the new set of statistics. However, as is clear from the following chart, this figure is arguably not the most reliable indicator of the impact of fees, given its evident volatility over time due to large variations in the monthly number of multiple claims (that is, the total number of claimants in multiple claimant cases). That said, the impact of fees seems reasonably clear.

Chart 1: ET claims (singles & multiples), July 2012 to March 2014.

Chart 1

The impact of fees since July 2013 is much clearer when we look at the number of single claims by individual workers, which was down 64 per cent in Quarter 3, and was down again in Quarter 4, by 58 per cent compared to the same quarter a year ago. While the Ministry of Justice will no doubt be highlighting the 13 per cent increase from Quarter 3 to Quarter 4, at 1,763 the average monthly number of claims in Quarter 4 is still just 39 per cent of the average over the nine months prior to July 2013 (4,460).

Chart 2: ET claims (singles), October 2012 to March 2014

Chart 2

Somewhat surprisingly – to me at least – the number of multiple claimant cases, which in theory should be less affected by fees, has also fallen dramatically since July 2013. Down by 65 per cent in Quarter 3, from 1,390 to 485, the number of such cases was down again in Quarter 4, by 68 per cent compared to the same quarter a year ago.

Chart 3: ET multiple claimant cases, October 2012 to March 2014

Chart 3

Given that claimants in the very largest multiple claim cases each pay only a tiny fraction of the fees, the most obvious explanation for this fall in the number of multiple claimant cases would be that fees have cut out those cases with relatively small numbers of multiple claimants. However, this would imply a significant increase in the average number of claimants in multiple claimant cases. And, as the following chart shows, with the exception of September (when, presumably, there were one or two very large cases), the average number of claimants in multiple claim cases has not only not risen, but has actually fallen since July 2013.

Chart 4: Average number of claimants in multiple claimant cases, July 2012 to March 2014

Chart 4

So, something else would appear to be going on here. Have the unions run out of equal pay cases?

Indeed, for me the main story from this latest set of statistics is that fees have had a dramatic impact not just on the number of single claims by individual workers, but also on the number of multiple claims and multiple claimant cases – which, in theory, should have been much less affected by fees.

Chart 5: ET claims (multiples), October 2012 to March 2014

Chart 5

All in all, it’s hard to see how the Lord Chancellor can credibly deny that the introduction of hefty, upfront fees in July 2013 has had a dramatic impact on the number of claims – both singles and multiples. Which means, if he does not now reform the fees regime (and substantially reduce the level of fees), he is likely to have to do so following an embarrassing defeat in the Court of Appeal at the hands of UNISON later this year (the appeal is currently scheduled for hearing sometime between 10 September and 10 December 2014).

The incredible shrinking fee remission fig leaf

In response to extensive criticism of the fees regime since July 2013, ministers have argued that access to justice is protected for low-income claimants by the associated fee remission scheme. However, the only figures on fee remission applications that the Ministry of Justice has been willing to release to date – covering the period up to 31 December – suggest that only about six per cent of all ET claimants obtain any fee remission.

According to these figures, provided by the Ministry in response to a series of parliamentary questions by shadow justice minister Andy Slaughter MP, just 600 “individuals or groups of individuals” were granted fee remission between 29 July and 31 December, while 1,800 fee remission applications were rejected. And in that period there was a total of 10,208 single claims (9,305) and multiple claim cases (903). So remission was applied for in just 23 per cent of all cases, and three out of four of those applications were rejected.

Yet as recently as September 2013, in its final Impact Assessment on the revised fee remission scheme, the Ministry of Justice suggested that 31 per cent of all ET claimants would be eligible for full (25 per cent) or partial (six per cent) fee remission.

In short, the fee remission scheme has so far proven to be a very small fig leaf indeed, and seems unlikely to provide the Lord Chancellor with much cover in the Court of Appeal.

Queen’s Speech: “May government will achieve grayth in hollow cable”

So, going by their breathless blog announcements earlier today, the most exciting legislative measure that the Liberal Democrats have been able to come up with for this week’s Queen’s Speech is … [drum roll] … an increase in the maximum penalty that can be imposed by HMRC for non-compliance with the national minimum wage.

Not only is this not news – the increase was formally announced by Vince Cable’s department in January, and was then re-announced in February – but in practical terms it’s next to meaningless, for the simple reason that very few if any of the minimum wage rogues caught by HMRC will receive financial penalties anywhere near the new maximum.

Until March this year, employers found by HMRC to have breached the minimum wage had to pay the unpaid wages, plus a financial penalty calculated as 50 per cent of the total underpayment for all workers found to have been underpaid, subject to a maximum of £5,000. However, following January’s announcement and the tabling of new Regulations, on 7 March the financial penalty percentage increased from 50 per cent to 100 per cent of the total unpaid wages owed to workers, and the maximum penalty increased to £20,000.

Now we’re told that, in line with the January and February announcements, a Bill in the Queen’s Speech will increase that maximum penalty to £20,000 per underpaid worker. Which will have all those minimum wage rogues running for cover! Er …won’t it?

Well, possibly, but I very much doubt it. In 2012/13 – the most recent year for which the relevant HMRC data is available – the average amount of underpaid wages was just … £300 per worker. Which means that, even under the new Regulations that came into force in March, the average financial penalty is in the region of £300 per worker – or just 1.5 per cent of the £20,000 per worker maximum that the Liberal Democrats, at least, seem to see as their jewel in the Queen’s Speech crown.

Indeed, we also know that, in 2012/13, just 51 (seven per cent) of the 708 minimum wage rogues caught by HMRC received the then maximum penalty of £5,000.  From which it seems reasonable to assume only a very small number of employers will receive the current maximum penalty of £20,000 that came into force in March, let alone the £20,000 per worker for which Vince Cable is now set to legislate.

In any case, if even the current maximum penalty of £20,000 is considered inadequate, why does Vince Cable not simply increase it to £50,000, or £100,000? That wouldn’t require a new Bill – the financial penalty percentage and maximum penalty can be increased at the flick of a minister’s pen, as they were in March.

The answer, of course, is that this measure has little if anything to do with ‘enhancing enforcement of the national minimum wage’. It’s a political move, intended to capture a few headlines and shoot one of Labour’s low pay foxes: Ed Miliband and other shadow ministers have repeatedly indicated they would increase the minimum wage financial penalties if elected in 2015.

While politicians play these meaningless games, back in the real world the bottom line is that better enforcement of the minimum wage requires a bigger chance of rogues getting caught by HMRC. And that means more HMRC boots on the ground. Which no political party is (yet) offering.

Postscript

Since I write and posted the above on Sunday, HMRC has issued a press release with key figures on enforcement of the minimum wage in 2013/14. This shows that, in 2013/14, the average  amount of underpaid wages was just … £205 per worker. Which means that, even under the new Regulations that came into force in March, the average financial penalty is just £205 per worker – or just one per cent of the proposed £20,000 per worker maximum. Interestingly, unlike last year, the press release does not include a figure for the number of employers who received the maximum penalty (of £5,000). Why could that be, I wonder?

Update (19 June):

BIS has today, in response to a parliamentary question by Caroline Lucas MP, confirmed that in 2013/14,  just 52 (eight per cent) of the 652 minimum wage rogues caught and issued with a financial penalty by HMRC received the then maximum penalty of £5,000.