Warning: This post contains selected statistics, taken in isolation and out of context (© S Vara)
So, today the Ministry of Injustice has coughed up another set of quarterly tribunal statistics – this one covering July to September 2015 (Q2 of 2015-16) – and we can hammer a few more nails into the coffin of that wonder of Tory intellectual thought, the Hancock Theorem of Vexatious ET Claims.
According to the second cleverest member of the Government – I’m sure Mr Hancock himself would concede top place to that titan of intellect, injustice minister Shailesh Vara – the success rate of employment tribunal (ET) claims should by now be bobbing around at or just below 100 per cent, all the vexatious and otherwise unfounded claims having been weeded out by the hefty, upfront fees introduced by the also very clever Chris Grayling in July 2013.
Unfortunately – not that the Cabinet Office minister gives a flying fuck – the Hancock Theorem has not been supported by the Ministry of Injustice’s own figures, even when taken in context. These have so far suggested that, far from going through the roof, the success rate has fallen significantly since mid-2014. Oops.
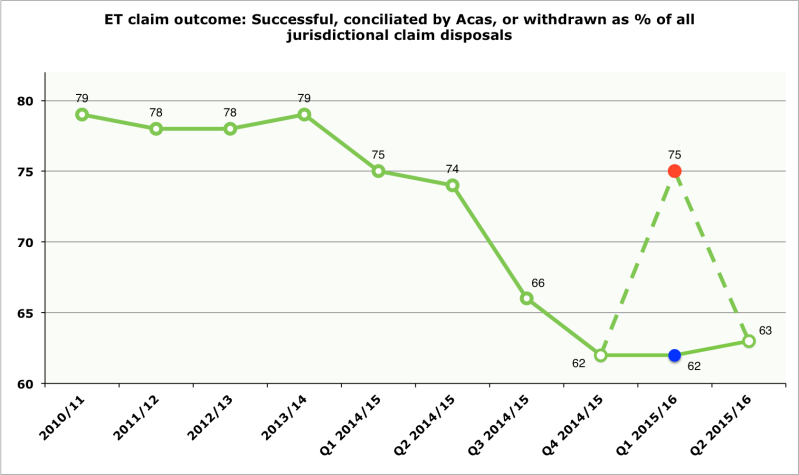
And today’s new figures will not increase Mr Hancock’s chances of winning the Fields Medal. Once again, in what is the sixth quarter since we could first have expected to see the impact of fees reflected in the outcome figures, the overall success rate – that is, including claims conciliated by Acas, or settled – is well down on pre-fees levels (but, at 63%, is one whole percentage point up on the last two quarters, so maybe there’s still some hope for the Hancock Theorem).
At 14%, the narrow measure of success is also down on pre-fees levels – and certainly not zooming towards 100 per cent, as the Hancock Theorem predicts. And, at 37%, the proportion of unsuccessful claims is once again significantly up on pre-fees levels, despite all the weak and vexatious claims having been weeded out by fees.
Luckily for Gem Reucroft, who likes charts, this is best illustrated by means of two charts:
Given that the Ministry statistics on which the above charts are based are highly selective, are taken in isolation and are 110 per cent out of context, I can’t really be arsed to explain the dotted lines in Q1 of 2015-16. But if you really need to know, all is explained towards the end of this previous post.


Spare a thought for the overworked hard pressed employment judges Lording over their 6 figure salaries?
Are the figures below linked to the collapse in claim numbers?
The number of Employment Tribunal Judges has collapsed since 2011.
In 2011 there were 385 full time and fee paid employment judges (source FOI 79448)
At present 31/03/2016 there are 368 (source FOI 104087)
This represents a staggering drop of 4.4% just slightly out of line with the 60% drop in ET claims.
It would be interesting to overlay these shocking figures on the et statistics
If you require copies of the source documents please contact me d09l45@gmail.com